

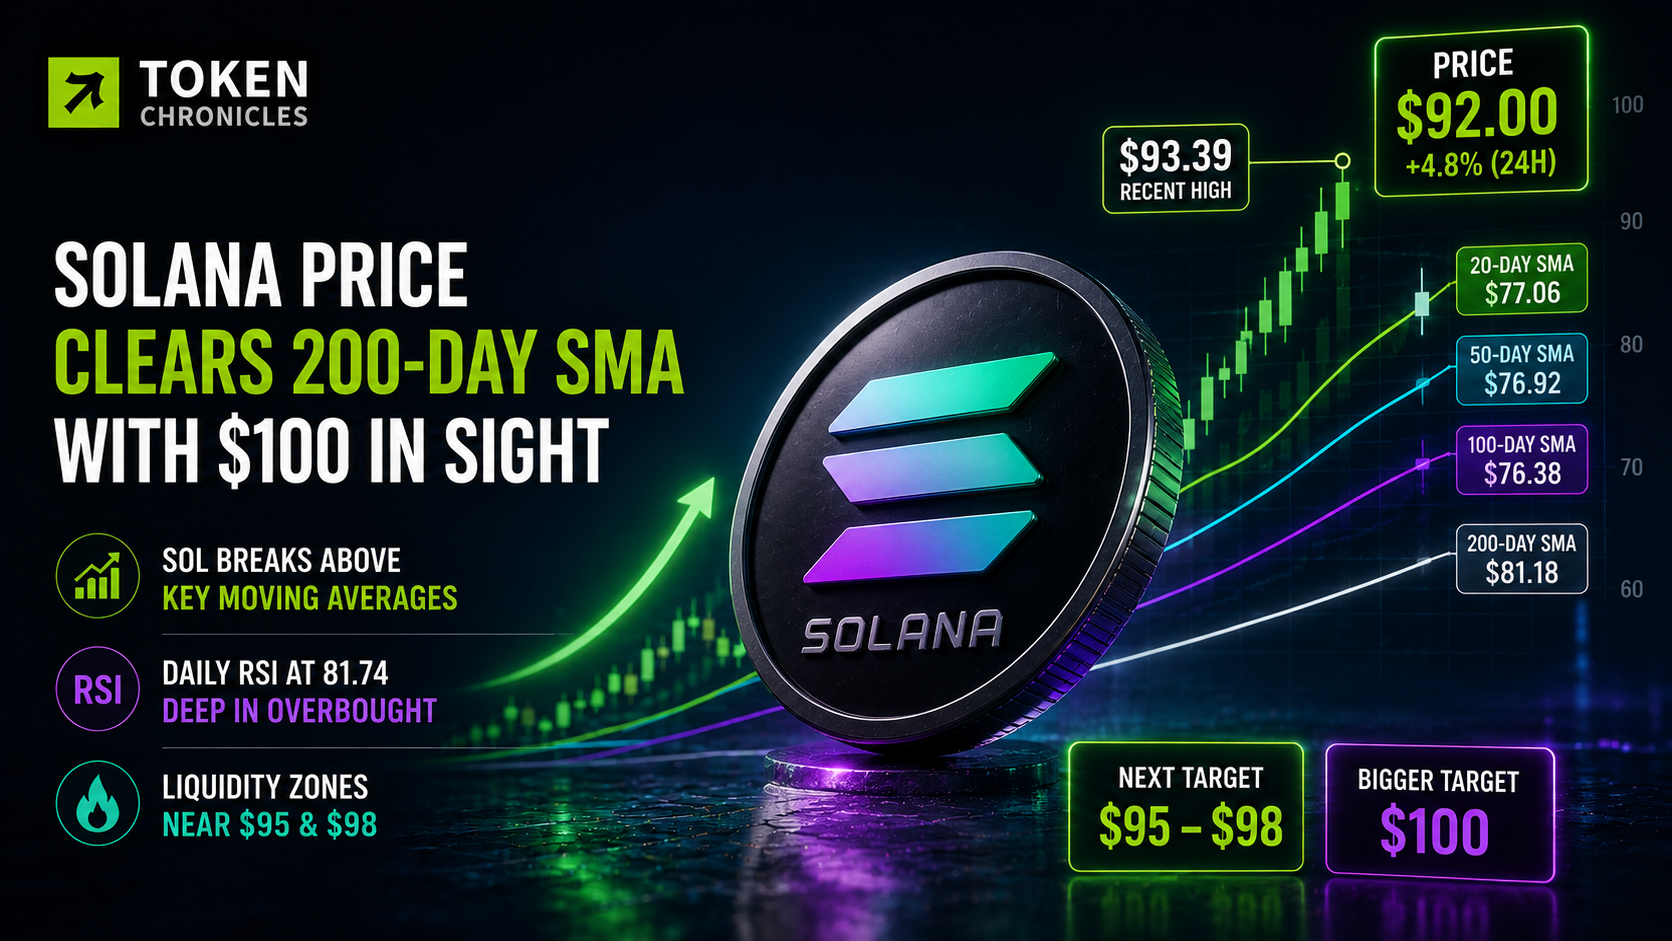
Solana (SOL) has staged a strong recovery, gaining roughly 25% over the past week and briefly reaching $93.39 on Aug. 21. The rally pushed SOL above several major moving averages and opened the possibility of a move toward $98 and the psychological $100 level.
However, momentum indicators are flashing caution. SOL’s daily RSI has climbed to 81.74, placing the token firmly in overbought territory and increasing the possibility of a short-term pullback.
Key takeaways
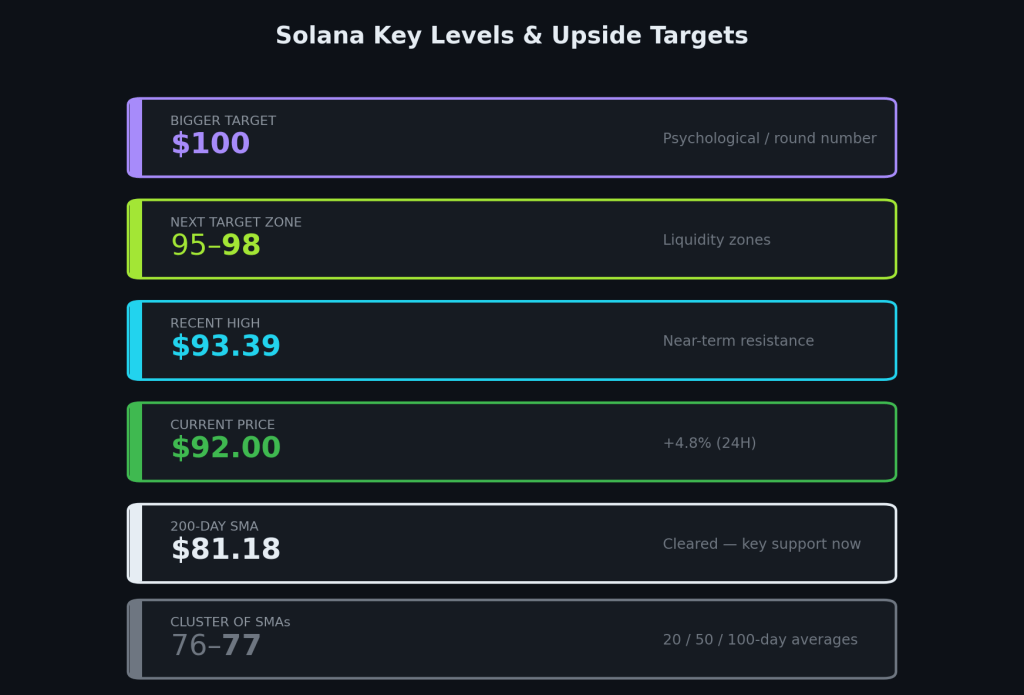
- SOL has moved above its 20-, 50-, 100- and 200-day SMAs.
- Daily RSI at 81.74 signals heavily stretched momentum.
- Liquidity is concentrated around $93–$95, with additional interest near $98.
- Key downside support sits around $90, $88 and $81.
SOL breaks out of a two-month trading range
SOL was trading near $92 after touching $93.39, extending its weekly advance to approximately 25%. The move pushed the token beyond the $76–$78 resistance zone that had capped several recovery attempts throughout July and early August.
The breakout also carried SOL above its previous swing high near $82, creating a higher high and improving the short-term technical structure.
Trading activity increased alongside the move, suggesting stronger participation as SOL returned to price levels last seen in May. The next major resistance area sits between approximately $94 and $98, where sellers previously emerged.
A broader crypto short squeeze also contributed to the rally, with more than $4 billion in bearish positions reportedly liquidated over 48 hours.
Network and institutional developments add support
The price rally comes alongside several developments supporting Solana’s broader ecosystem.
Shinhan Asset Management has partnered with the Solana Foundation to explore a Korean won-denominated tokenized bond fund, potentially expanding Solana’s role in institutional real-world asset markets.
Network activity has also remained strong. Solana reportedly processed 1.2 billion non-vote transactions in a single week, while improvements to block compute capacity have given applications additional room to operate.
The planned Alpenglow upgrade could further improve network performance by reducing transaction finality times and changing validator operations.
Broader market conditions have also supported risk assets, including expectations surrounding US Treasury liquidity, softer long-term yields and a weaker dollar.
Overbought RSI creates short-term risk
Despite the bullish breakout, SOL’s momentum has become increasingly stretched.
The token’s 14-day RSI reached 81.74, significantly above the 70 level commonly associated with overbought conditions. An elevated RSI does not necessarily signal an immediate reversal, but it indicates that prices have risen considerably faster than their recent average.
SOL is currently trading above:
- 20-day SMA: $77.06
- 50-day SMA: $76.92
- 100-day SMA: $76.38
- 200-day SMA: $81.18
The 200-day SMA is particularly important because it had previously acted as a major long-term resistance level.
A pullback toward $87–$90 could therefore represent a normal retest rather than an immediate breakdown.
$95 and $98 become key levels
Liquidation data shows that SOL has already moved through several layers of short liquidity between $80 and $92.
Additional liquidity appears concentrated around $93–$95. A sustained move through that zone could trigger another wave of short covering and accelerate the rally toward the previous range high near $98.
Beyond that, the $100 psychological level becomes the next major target.
On the downside, $90 and $88 are important near-term support zones. A deeper correction could bring $83–$84 into focus, while the $80–$81 region aligns closely with the 200-day moving average.
Can SOL reach $100?
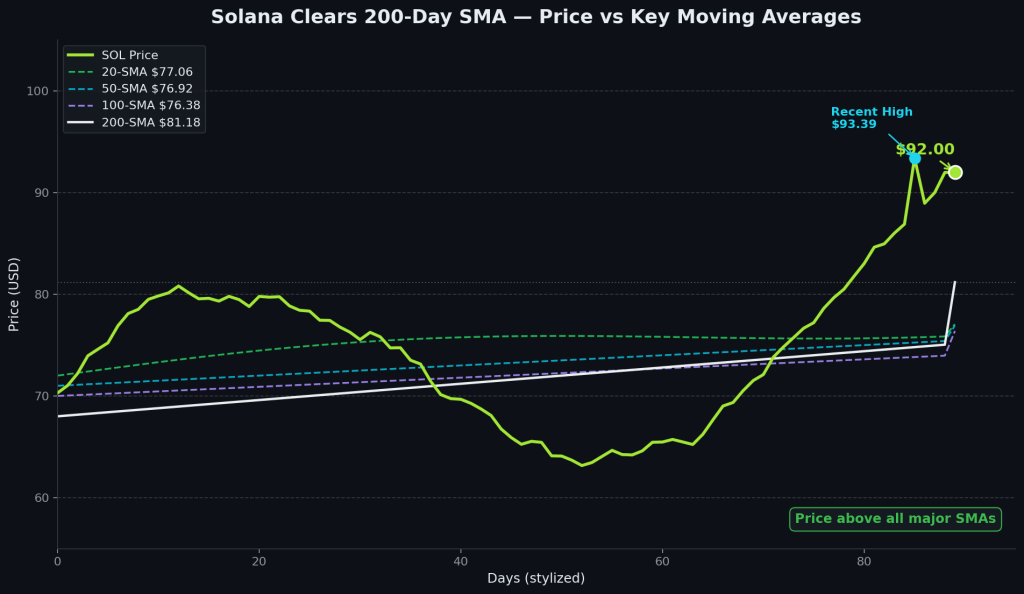
The bullish scenario depends on SOL maintaining its breakout and establishing support above the $87–$90 region.
A sustained move through $95 would strengthen the case for a retest of $98, followed by $100. A successful break above $100 could signal a broader change in Solana’s longer-term market structure.
However, rejection around $93–$95 combined with weakening momentum could trigger a pullback toward $90 or lower.
For now, the key question is whether real spot demand can sustain SOL’s advance after the short squeeze fades. The technical picture has turned significantly more bullish, but the elevated RSI means traders should also prepare for increased volatility.