


Bitcoin’s market has entered an unusually calm phase, with one-month realized volatility reaching historically low levels, according to blockchain analytics firm Glassnode.
The firm’s analysis suggests that the strongest statistical relationship with Bitcoin’s recent volatility is not market capitalization, trading volume or derivatives activity, but the amount of Bitcoin held by long-term investors.
As more BTC moves into the hands of holders who are less likely to sell in the short term, the supply available for active trading can shrink. That dynamic may be contributing to Bitcoin’s subdued price fluctuations while also creating the potential for sharper moves if market demand suddenly changes.
Key Takeaways
- Bitcoin’s one-month realized volatility is historically low, according to Glassnode.
- Long-term holder supply explained nearly 19% of the variation in detrended volatility in Glassnode’s analysis.
- Illiquid supply accounted for roughly 12%, while liveliness contributed about 11%.
- Long-term holders previously reached approximately 16.64 million BTC, or about 83% of circulating supply.
- Low volatility is not a reliable directional indicator and could precede either stronger upside or a sharp move in the opposite direction.
Long-Term Holders Emerge as the Strongest Variable

Bitcoin was trading around $78,449 when the analysis was published, after slipping below $79,000 following an unsuccessful attempt to remain above the $80,000 level.
Those short-term price movements stand in contrast to the broader volatility picture.
Glassnode examined 13 different variables to determine how much of Bitcoin’s detrended volatility variance each could explain. Detrending removes the longer-term statistical direction from the data, making it easier to examine relationships involving shorter-term fluctuations.
The strongest variable was long-term holder supply, which accounted for nearly 19% of the variation.
It was followed by illiquid supply at approximately 12% and liveliness at around 11%.
The results suggest that the behavior and distribution of Bitcoin’s supply may currently have a stronger relationship with volatility than several conventional market indicators.
More Bitcoin Is Moving Into Patient Hands
Glassnode generally defines long-term holder supply as Bitcoin that has remained unmoved for at least 155 days.
That investor cohort has been steadily accumulating a larger share of the available Bitcoin supply. The long-term holder balance reached approximately 16.64 million BTC, equivalent to around 83% of circulating supply, in June.
The cohort subsequently reached another reported record on July 21.
This shift matters because coins controlled by long-term holders are statistically less likely to enter the market during ordinary short-term trading activity.
As these investors absorb coins sold or distributed by other market participants, the amount of BTC readily available for active trading can decline.
That creates a market in which relatively fewer coins are circulating among short-term traders while a larger portion remains effectively dormant.
Market Cap and Trading Activity Have Weaker Relationships
Interestingly, Bitcoin’s market capitalization ranked among the weaker variables in Glassnode’s comparison.
Market capitalization explained only slightly more than 3% of the variation in detrended volatility. Coin velocity a measure comparing on-chain transaction activity with market capitalization produced a similarly limited relationship.
Other indicators performed somewhat better but remained behind long-term holder supply.
Glassnode’s analysis attributed approximately:
- 7% to spot trading volume
- 8%–9% to leverage
- 8%–9% to exchange balances
- 8%–9% to futures open interest
The results indicate that Bitcoin’s current volatility environment cannot simply be explained by how large the market is or how much trading is taking place.
Instead, the distribution of available supply appears to be an important part of the picture.
Why Illiquid Supply Matters
The concept of illiquid supply is particularly relevant in the current environment.
When Bitcoin moves into wallets whose owners historically spend their coins infrequently, those coins become less available to the active market.
If demand remains relatively stable while the liquid supply shrinks, the market can potentially experience lower day-to-day volatility.
But the same structure can work in the opposite direction.
If demand suddenly increases while relatively little BTC is readily available for purchase, price movements could become more pronounced because buyers are competing for a smaller pool of liquid coins.
Conversely, if previously dormant coins return to circulation during a period of weakening demand, selling pressure could increase quickly.
Low Volatility Does Not Guarantee a Bitcoin Rally
Historically, periods of unusually low Bitcoin volatility have sometimes appeared before significant price advances.
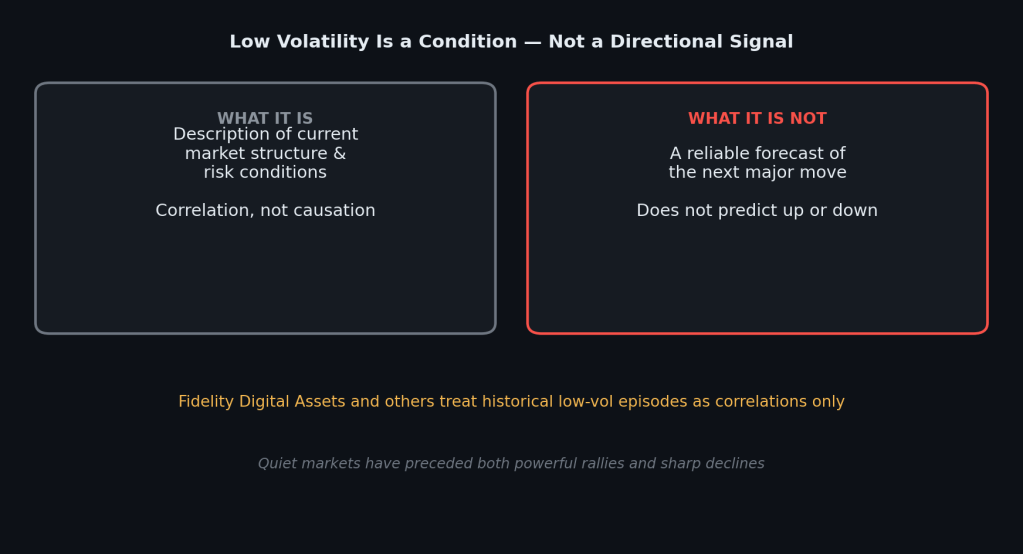
However, that relationship should not be interpreted as a dependable forecasting tool.
As the supplied analysis notes, previous research from Fidelity Digital Assets treats these historical relationships as correlations rather than evidence of causation.
In other words, low volatility may occur before a major Bitcoin move, but it does not tell investors whether that next move will be upward or downward.
This distinction is particularly important for traders who might interpret historically low volatility as an automatic bullish signal.
Instead, the current environment should be viewed primarily as a description of market structure and risk conditions.
A Quiet Market Could Produce a Bigger Move Later
Low volatility can create the impression that Bitcoin has entered a stable phase.
But beneath the surface, the concentration of supply among long-term holders could potentially make the market more sensitive to sudden changes in demand.
If buyers return aggressively, limited liquid supply could amplify upward price movements.
If selling pressure emerges and leverage is elevated, derivatives markets could similarly accelerate a decline.
Funding rates, futures positioning and leverage can all influence how quickly such a move develops once volatility returns.
This makes the current environment something of a compressed-volatility setup rather than necessarily a permanently calm market.
What Bitcoin’s Supply Structure Means for Traders
The latest Glassnode analysis suggests that Bitcoin’s volatility is increasingly linked to who holds the coins and how willing those holders are to spend them.
With long-term holders controlling a historically large portion of circulating supply, the market may have less readily available liquidity than headline trading volumes suggest.
That could help explain why Bitcoin has experienced relatively muted volatility despite continuing to trade at substantial valuations.
At the same time, traders should avoid treating the data as a prediction of Bitcoin’s next price target.
Historically low volatility is a condition, not a direction.
The next major change in demand, liquidity, leverage or holder behavior could determine whether Bitcoin breaks out of its current quiet period to the upside or experiences a much sharper correction.
For now, the dominant story is one of Bitcoin supply becoming increasingly concentrated in long-term hands while market volatility sinks to historically subdued levels a combination that could set the stage for a much more significant move when the current equilibrium eventually breaks.