


Bitcoin may be entering one of the most important accumulation periods of its current market cycle, with several long-term indicators suggesting that BTC could be at or approaching a major cycle low in both price and time.
Bitcoin is currently trading roughly 50% below its all-time high, while the broader bear-market phase has extended beyond 40 weeks. Historically, deep drawdowns combined with extreme relative valuations and depressed onchain metrics have tended to emerge during the later stages of Bitcoin bear markets.
Several indicators are now approaching or reaching levels rarely seen in Bitcoin’s history. These include BTC’s relative performance against the Nasdaq and gold, its proximity to realized price, and the historical timing of previous bear-market bottoms.
Taken together, the signals suggest that the period between now and the end of 2026 could represent a potentially important long-term reaccumulation window, although historical patterns provide no guarantee that the current cycle will follow previous ones.
Bitcoin hits historic oversold levels against the Nasdaq
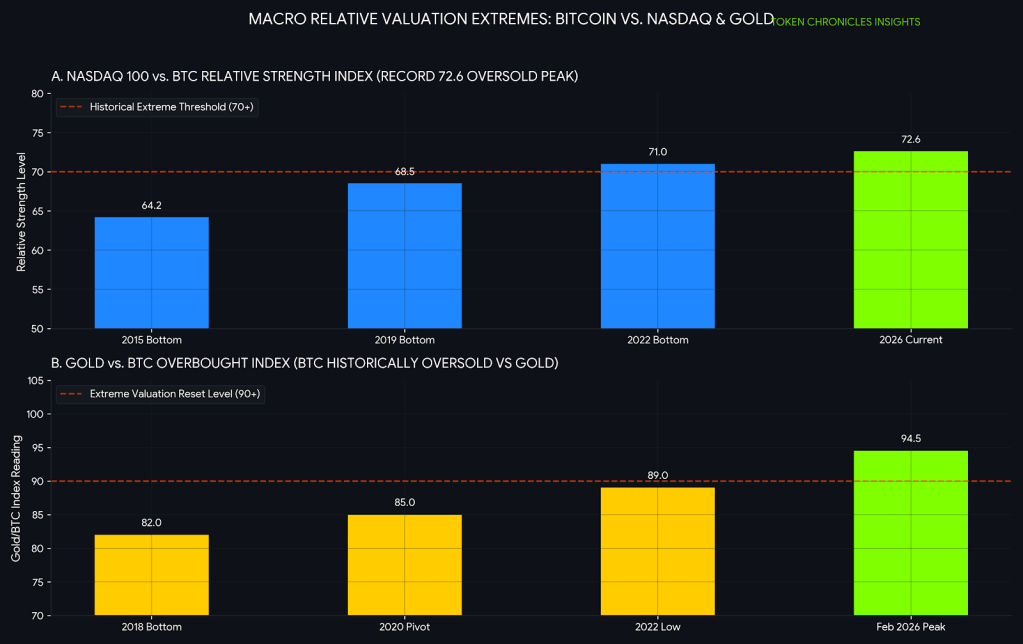
One of the strongest signals comes from Bitcoin’s performance relative to the Nasdaq 100.
A long-term relative-strength model comparing the Nasdaq with Bitcoin recently reached its most extreme reading on record. In practical terms, this indicates that Bitcoin has become historically oversold relative to the Nasdaq on a high-timeframe basis.
Similar extreme conditions have appeared only a handful of times, including around major Bitcoin market-cycle lows in 2015, 2019 and 2022.
The current episode is particularly notable because of both its magnitude and duration.
The indicator reportedly reached a record reading of 72.6 for the Nasdaq relative to BTC, surpassing its previous peak from 2022. The current extreme condition has also persisted longer than previous episodes.
Historically, these signals have not been particularly useful for predicting Bitcoin’s performance over the following few weeks or months.
Their significance has instead appeared over much longer periods.
Previous extreme readings were followed by substantial Bitcoin appreciation and BTC outperformance against the Nasdaq over one-to-three-year horizons.
That does not necessarily mean an immediate recovery is approaching. In previous cycles, Bitcoin sometimes experienced additional downside before beginning a sustained long-term recovery.
Bitcoin also reached an extreme against Gold
A similar pattern has emerged when comparing Bitcoin with gold.
Gold significantly outperformed Bitcoin during portions of the current downturn, pushing the Gold-to-Bitcoin relative-strength indicator toward historically extreme territory.
In February 2026, the indicator reportedly showed gold at its most overbought level against Bitcoin in the pair’s history, or conversely, Bitcoin at its most oversold relative to gold.
Historically, comparable extremes have appeared around periods associated with major Bitcoin valuation resets.
Over longer horizons, previous occurrences were followed by Bitcoin outperforming both gold and the U.S. dollar.
Together, the Nasdaq and gold comparisons suggest Bitcoin has undergone an unusually deep relative repricing against two very different asset classes: growth-oriented equities and traditional monetary safe-haven assets.
Bitcoin’s $53,000 realized price becomes a key Level

Another important indicator is Bitcoin’s realized price, currently estimated at approximately $53,000.
Realized price attempts to calculate the aggregate onchain cost basis of Bitcoin by valuing coins at the price at which they last moved onchain.
Historically, it has served as an important reference point during deep bear markets.
Bitcoin has spent only a relatively small portion of its history trading below realized price, and previous major bear-market bottoms have all involved BTC falling below this aggregate cost basis.
With realized price currently around 18% below spot, further downside cannot be ruled out.
In fact, a decline toward or temporarily below $53,000 would remain consistent with previous Bitcoin bear-market structures rather than necessarily representing an unusual breakdown.
Historically, entering below-realized-price territory has tended to occur during the later stages of major bear markets.
Long-term returns following those periods have generally been positive, although the magnitude of subsequent gains has declined as Bitcoin has matured.
Historical cycle timing points toward late 2026
Time provides another important dimension.
Previous major Bitcoin bear markets following the 2013, 2017 and 2021 cycle peaks reportedly established their ultimate price bottoms within approximately 60 weeks of their respective all-time highs.
The current cycle is now beyond week 40.
If that historical pattern broadly repeats, Bitcoin could establish its definitive cycle low sometime before or around the end of November 2026.
This does not mean Bitcoin must continue declining until then.
The bottom may already have occurred, or the market could spend months consolidating rather than making dramatically lower lows.
Instead, the historical cycle clock suggests Bitcoin may already be entering the later stages of its broader bear-market process.
Under that framework, roughly the next several months could become particularly important for determining the long-term market structure.
Bitcoin’s maturing market could mean lower future returns
There is an important complication to the bullish long-term thesis: Bitcoin’s historical returns appear to be diminishing as the asset matures.
BTC has delivered extraordinary returns since its creation, but each successive cycle has generally produced smaller percentage gains than earlier cycles.
The same phenomenon can be observed following extreme relative-strength signals.
Although previous cycle-bottom conditions were followed by strong multi-year returns, the magnitude of those returns declined substantially from one cycle to the next.
This suggests investors may need to rethink the traditional assumption that simply maintaining permanent Bitcoin exposure will automatically generate the extraordinary returns seen during Bitcoin’s earlier years.
As the market matures, timing exposure around periods of extreme valuation and market stress may become increasingly important.
The opportunity may shift from simply being permanently bullish to identifying periods when Bitcoin offers unusually favorable long-term risk-reward conditions.
2026 could become a Reaccumulation Year
Combining the different indicators produces a potentially significant picture.
Bitcoin is deeply below its previous peak.
Its relative valuation against both the Nasdaq and gold has reached historic extremes.
Its spot price has moved substantially closer to realized price.
And the market is entering the historical time window during which previous Bitcoin bear markets established their final bottoms.
If historical patterns remain relevant, the period between now and December 2026 could represent a broad reaccumulation zone for investors with multi-year horizons.
However, this thesis does not imply that Bitcoin has necessarily reached its absolute bottom.
A move toward realized price around $53,000, or even temporarily below it, remains possible under historical precedent.
The stronger argument is therefore about time horizon rather than precise bottom timing.
Previous extreme signals have offered limited guidance about what Bitcoin would do over the following 30 to 120 days. Their historical significance became much clearer over the following one to three years.
2027 and 2028 could become more constructive
Scenario analysis based on previous cycles suggests Bitcoin’s near-term trajectory could remain volatile and uncertain through the remainder of 2026.
The longer-term picture becomes more constructive if historical cycle behavior repeats.
Previous bear markets have eventually transitioned into multi-year recovery phases, with Bitcoin reclaiming previous highs faster in successive cycles.
If that pattern continues, Bitcoin could potentially return to record territory before early 2028.
Such projections should not be interpreted as price forecasts. Bitcoin’s market structure has changed considerably, making direct comparisons with previous cycles increasingly uncertain.
This Bitcoin cycle is structurally different
Historical models have significant limitations.
Bitcoin has experienced only a small number of complete market cycles, meaning many widely followed cycle indicators rely on very limited datasets.
The current market is also structurally different from previous cycles.
Bitcoin now operates in an environment shaped by spot ETFs, institutional custody, corporate treasury strategies, sophisticated derivatives markets, and significantly greater integration with traditional finance.
These developments could alter how future cycles behave.
The indicators discussed also should not be considered completely independent signals.
Bitcoin becoming historically oversold against other assets, approaching realized price and reaching the later stages of a bear-market timeline are all partially consequences of the same underlying event: a prolonged and substantial decline in Bitcoin’s price.
Their simultaneous appearance therefore does not automatically provide multiple independent confirmations of a bottom.
Bitcoin may be entering a rare long-term opportunity zone
No single indicator can reliably identify Bitcoin’s exact bottom.
However, several historically unusual conditions are now appearing simultaneously.
BTC is deeply below its all-time high, historically oversold relative to major benchmark assets, approaching an important onchain valuation level, and moving deeper into the timeframe where previous bear markets established their final lows.
The market could still experience significant volatility and further downside before a durable recovery begins.
But if Bitcoin’s historical cycle behavior remains broadly relevant, the remainder of 2026 may prove more important as a long-term accumulation period than as a period for predicting the exact market bottom.
For long-term investors, the key signal may not be that Bitcoin has definitively bottomed today.
It is that the market appears to be moving into a historically rare zone where long-term risk-reward has previously become increasingly favorable, even when short-term conditions remained uncertain.