

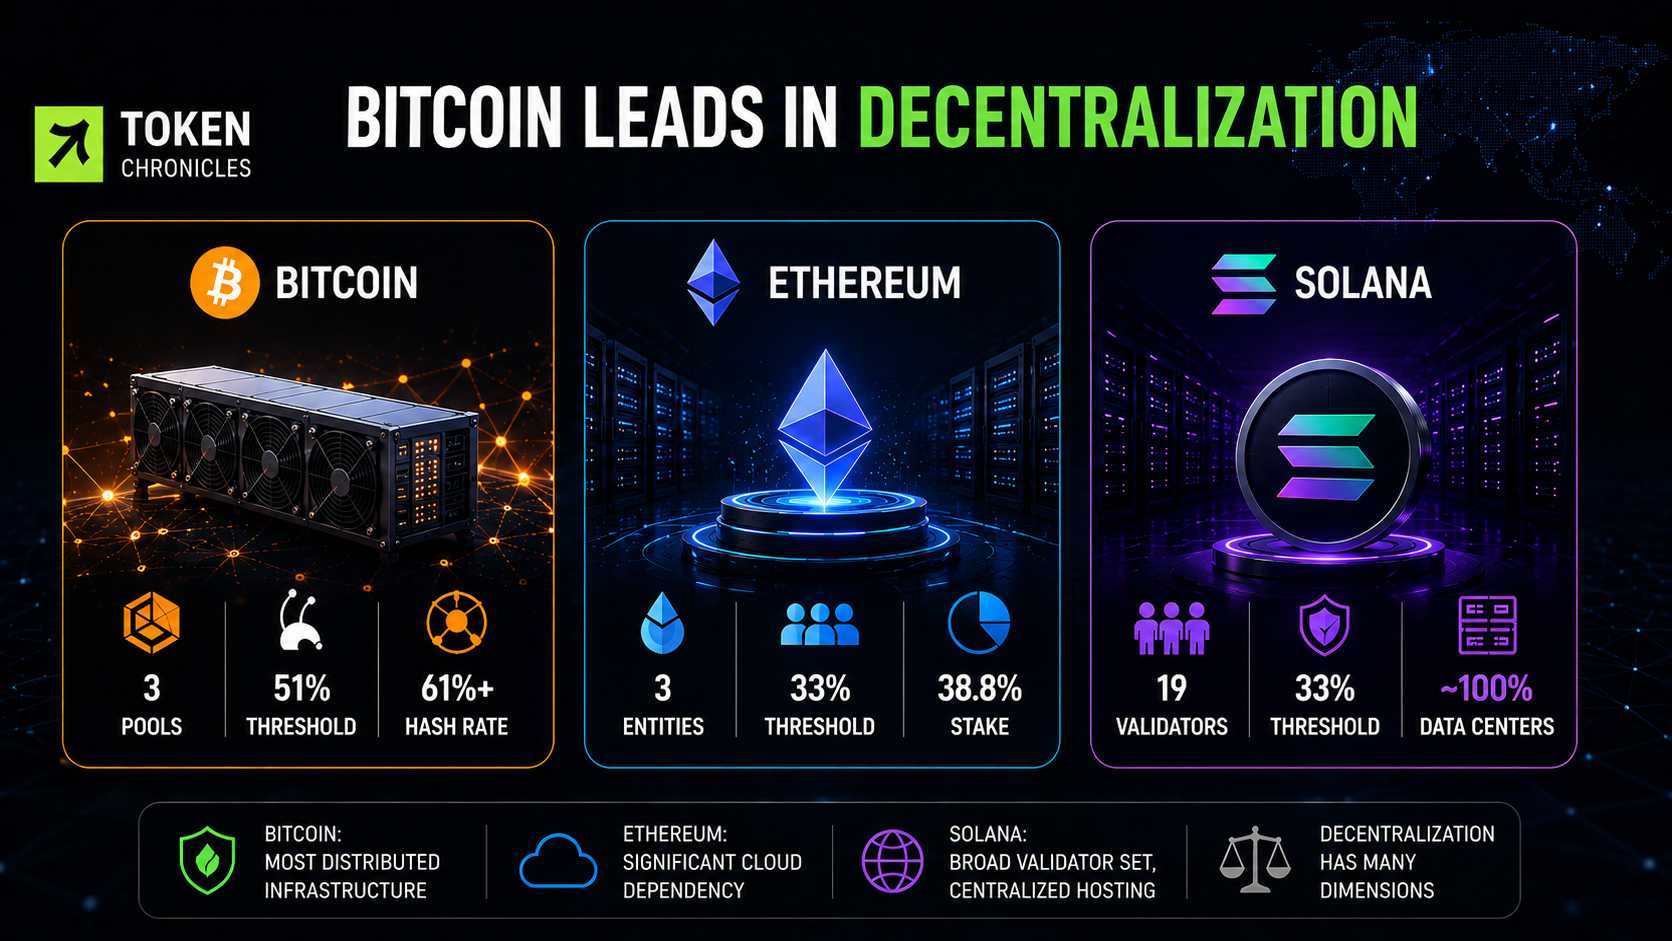
A joint analysis from ARK Invest and Glassnode places Bitcoin ahead of Ethereum and Solana across several measures of blockchain decentralization. The study highlights Bitcoin’s relatively broad infrastructure and low verification costs, while also showing that every major network faces different forms of concentration risk.
- Bitcoin reaches the 51% block-production threshold through three major mining pools.
- Ethereum crosses its 33% threshold through three major staking entities.
- Solana requires 19 validators to exceed its selected 33% threshold.
- Bitcoin has a comparatively distributed infrastructure footprint, with significant use of Tor and non-data-center nodes.
- Ethereum relies heavily on cloud infrastructure, including Amazon Web Services.
- Solana has a broad validator base but greater dependence on commercial data centers.
A Broader Look at Blockchain Decentralization
ARK Invest and Glassnode’s 32-page study, The Decentralization Spectrum: Design Tradeoffs in Digital Assets, examines Bitcoin, Ethereum and Solana across several dimensions.
Rather than treating decentralization as a single statistic, the researchers evaluated factors including ownership concentration, ease of exiting the network, verification costs, critical resilience, reconstruction costs, and infrastructure distribution.
The study ultimately ranked Bitcoin highest overall, followed by Ethereum and Solana.
However, the researchers caution that the measurements should not be interpreted as meaning that a handful of companies literally control these networks.
Mining pools, staking platforms and infrastructure providers can represent large amounts of network activity without owning all of the underlying hardware or assets. Participants can also move their resources, meaning measured concentration does not necessarily equal permanent control.
Bitcoin Reaches the Threshold Through Three Mining Pools
For Bitcoin, the study used a 51% hash-rate threshold to calculate its Nakamoto coefficient.
Three mining pools were sufficient to cross that threshold:
- Foundry USA: 27.27%
- AntPool: 17.06%
- F2Pool: 16.96%
Together, the three pools represented more than 61% of the measured hash rate, producing a Nakamoto coefficient of three under the study’s methodology.
Other significant pools included ViaBTC at 9.50% and SpiderPool at 5.82%.
Importantly, mining pools do not necessarily own the machines generating the hash power they coordinate. Individual miners can connect to a pool for more predictable rewards and later redirect their computing power elsewhere.
The study estimated that moving a 1% share of Bitcoin’s hash rate could take only about 29 seconds.
That mobility makes the concentration of mining pools different from permanent ownership concentration.
Nevertheless, large pools still have operational influence because they typically construct the templates used by participating miners when producing blocks. Pool concentration can therefore create risks around transaction ordering and censorship even when the underlying mining equipment is widely distributed.
Ethereum’s Staking Concentration Works Differently
Ethereum was assessed using a 33% stake threshold, rather than Bitcoin’s 51% threshold.
The reason is different network mechanics: controlling approximately one-third of Ethereum’s staked ETH can create risks around transaction finality.
The study’s July data showed:
- Lido: 23.04%
- Binance: 8.88%
- Kraken: 6.91%
Together, those three entities represented approximately 38.8% of staked ETH, crossing the study’s selected threshold.
However, Lido should not be viewed as a single validator or machine. Its stake is distributed among multiple node operators through a common protocol and governance structure.
This illustrates why the way researchers define an “entity” can significantly influence decentralization measurements.
Ethereum also has substantially slower exit dynamics than Bitcoin. The study estimated that exiting a 1% position could take around 14.6 days under normal conditions and potentially as long as 55.6 days during periods of heavy congestion.
Ethereum’s Client Diversity Adds Another Layer
Validator concentration is only one part of Ethereum’s decentralization picture.
The study also examined the software clients responsible for implementing the network’s rules.
For Ethereum’s execution layer, the reported distribution was:
- Geth: 34.88%
- Nethermind: 26.96%
- Reth: 18.98%
On the consensus side, Lighthouse represented approximately 54.16%.
Client diversity matters because relying heavily on one implementation can expose a large portion of the network to a common software vulnerability.
Consequently, measuring Ethereum’s decentralization solely through staking concentration would overlook another important source of systemic risk.
Solana Has the Highest Validator Threshold
Solana produced the strongest result among the three networks on the selected Nakamoto coefficient measure.
The study found that 19 validators were needed to exceed 33% of delegated stake.
The largest individual participants included:
- Figment: 3.78%
- Helius: 3.69%
- Jupiter: 2.91%
- Binance Staking: 2.81%
- Ledger by Figment: 2.16%
The remaining 84.65% of measured stake was distributed across other validators.
The report contains one discrepancy: one section refers to 20 entities, while its chart, comparison table and Glassnode summary report a coefficient of 19. The published table also indicates that the figure increased from 18 in March 2026.
Solana’s Infrastructure Creates a Different Risk
Although Solana performed strongly on validator distribution, its physical infrastructure was considerably more concentrated.
The study found that virtually all measured Solana infrastructure operated inside commercial data centers.
Approximately 68% was located in Europe and another 21% in North America.
Hosting concentration was also notable. TeraSwitch accounted for approximately 30.23% of measured stake, while the two largest hosting providers together represented around 35.7%.
This creates a potential distinction between validator decentralization and infrastructure decentralization.
A network can have hundreds of independently operated validators while several of those validators still depend on the same underlying infrastructure provider. A disruption at that provider could therefore affect multiple seemingly independent participants simultaneously.
Bitcoin Has Lower Verification Costs
Bitcoin also stood out for the relatively low cost of independently verifying its network.
The study estimated that hardware for a Bitcoin full node could cost approximately $289, compared with roughly $730 for Ethereum and around $21,478 for a Solana RPC node or validator-class configuration.
Storage requirements also varied significantly.
Bitcoin’s measured full-chain storage requirement was approximately 753 GB.
Ethereum required around 2 TB for a full archive configuration, while reconstructing Solana’s historical data was estimated at approximately 480 TB, partly because historical information is commonly handled through external providers.
These differences influence who can independently verify network activity.
Lower hardware and storage requirements make it easier for ordinary participants to run infrastructure, potentially broadening the network’s verification base.
Bitcoin’s Infrastructure Is More Widely Distributed
Bitcoin also showed a relatively diverse hosting profile.
According to the study, approximately:
- 16% of measured Bitcoin infrastructure operated in data centers.
- 63% of nodes operated through Tor.
- 15% used residential or self-hosted infrastructure.
Ethereum displayed a substantially different profile.
Approximately 49% of execution-layer nodes were hosted in cloud environments, while about 45% were self-hosted.
Amazon Web Services alone accounted for around 20%, while the two largest cloud providers represented approximately 27%.
The figures illustrate that geographic and infrastructure distribution can be just as important as the number of validators or miners when evaluating a blockchain’s resilience.
Decentralization Is Not One Number
The study’s overall ranking places Bitcoin first, Ethereum second, and Solana third, but the comparison is more nuanced than a simple leaderboard.
Bitcoin performed particularly well in areas such as ownership distribution, auditability and geographic resilience.
Ethereum generally occupied the middle position, benefiting from factors such as client diversity while facing greater concentration in staking and cloud infrastructure.
Solana performed strongly on its validator-based critical-resilience measure but faced disadvantages in areas such as infrastructure concentration, verification requirements and the cost of reconstructing historical data.
Concentration Depends on How the Network Is Measured
One of the study’s most important implications is that decentralization cannot be accurately described by a single statistic.
A mining pool may represent thousands of independent miners. A staking service may coordinate numerous validators. An exchange may hold assets belonging to a large number of customers.
Similarly, a blockchain can have geographically dispersed validators while depending heavily on a small number of cloud or hosting providers.
These differences mean that decentralization measurements should be viewed as maps of specific risks rather than absolute rankings of network independence.
Bitcoin Leads, but Every Network Has Trade-Offs
The ARK Invest–Glassnode analysis suggests that Bitcoin currently offers the strongest combination of infrastructure distribution, accessibility and resilience among the three networks studied.
Ethereum demonstrates a different model, balancing staking and client diversity with dependence on large staking providers and cloud infrastructure.
Solana’s architecture supports a large validator ecosystem and high throughput, but its infrastructure requirements create different centralization and resilience considerations.
The broader lesson is that blockchain decentralization is multidimensional. Mining and staking concentration, software diversity, physical infrastructure, verification costs and geographic distribution all matter—and a network can perform strongly in one area while remaining vulnerable in another.